Mobile Gaming Trends 2023: Insights from the Digital 2023 July Global Statshot Report
In July of this year, the analytical platform Data Reportal, in collaboration with We Are Social and Meltwater, released a new report – the Digital 2023 July Global Statshot Report.
The research encompasses over 300 slides dedicated to people’s behavior on the Internet, online shopping, social media, and mobile gaming trends. Furthermore, the Digital 2023 July Global Statshot Report raises questions about users’ adoption of AI, shifts in behavior patterns on social networks, and the choice of devices for gaming apps.
Below, we highlight key news that directly impacts the mobile industry and the digital sphere in general.
Key Takeaways:
- According to the UN, as of early July 2023, the global population reached 8.05 billion people. Over the past 12 months, the Earth’s population increased by 70 million individuals.
- In July 2023, the number of Internet users grew by 2.1%. The current user count stands at 5.19 billion people, or 64.5% of the global population.
- Currently, 60.6% of the global population are active users of social media. In July 2023, the total number of users reached 4.88 billion.
- Thanks to the addition of nearly 150 million new mobile users, the user base has grown by 2.7% over the past year.
Let’s get to the review.
Device ownership according to the Digital 2023 July Global Statshot Report
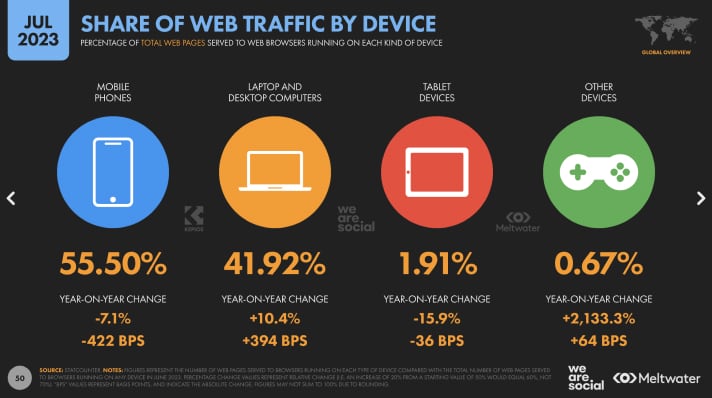
As anticipated, smartphones continue to hold pivotal positions among other devices. Thus, 96.8% of individuals aged 16 to 64 own a smartphone, while the number of desktop and laptop owners stands at 57.7%.
In essence, there is a noticeable growth in the presence of any mobile devices. As of July 2023, 96.9% of people own some kind of mobile device.
Notably, the share of mobile traffic is 55.50% and the share of desktop traffic is 41.92%.
Daily time spending on Internet
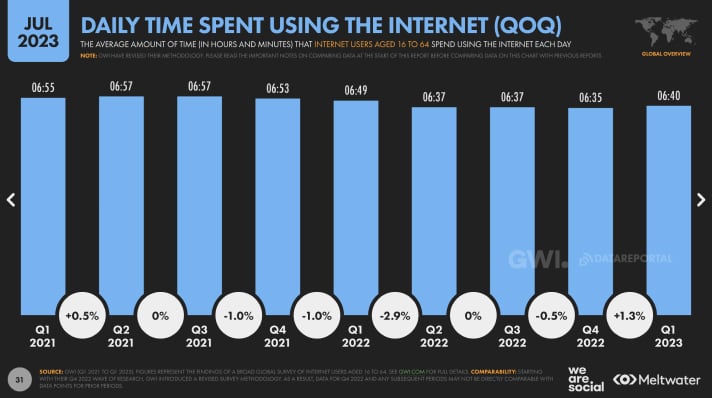
Compared to the beginning of 2023, by midsummer, user time spent on the Internet has increased by 1.3%. On average, people now spend approximately 6 hours and 40 minutes online.
For comparison: in Australia, the average online time is 6 hours and 20 minutes, in Turkey – 7 hours and 19 minutes, while in U.A.E. – 7 hours and 7 minutes.
Internet usage by age and device preferences
The age group that spends the most time on the Internet is 16-24 years old (around 7.5 hours), while the least time is spent by individuals aged 55-64 (approximately 5.5 hours).
Furthermore, when it comes to accessing the Internet, 94.4% of users prefer smartphones, whereas the share of desktop usage is 63.4%, and tablets account for 25.7%.
We talked about the growth of digital technology in 2023 and other digital news here.
Daily Internet usage: mobile/desktop
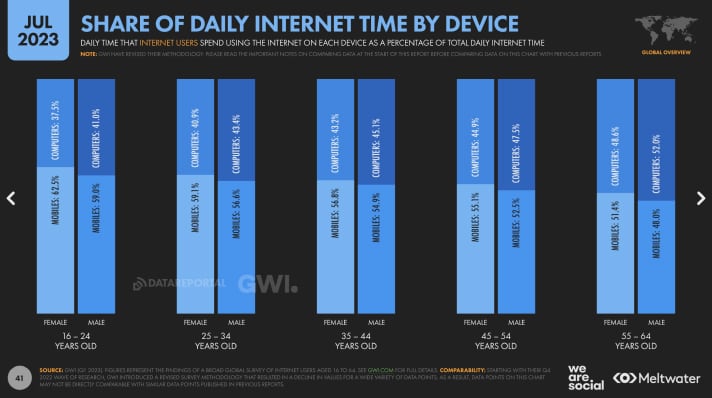
The average share of mobile usage in 2023 stands at 56.8%, while desktop usage accounts for 43.3%. Compared to the previous year, mobile growth has decreased by 0.2%, yet the mobile channel still prevails over desktop.
Interestingly, the younger the generation, the more it prefers mobile over desktop. For instance, among users aged 16-24, the mobile share is 62.5% and 59%, whereas for the 65-64 age group, it’s 51.4% and 48%, respectively.
Anyway, mobile advertising is a promising way of advertising. In apps, brands can place their ads and attract the attention of a loyal audience.
On the BYYD platform, we help advertisers get their messages to users and increase their visibility. If branding performance and audience loyalty are important to you, contact us at hello@byyd.me
Online activities and usage trends
Finding information remains the primary reason for being online. This is the opinion of 59.2% of users aged 16 to 65. Next on the list is keeping in touch with family and friends – 54.8%.
Among other reasons:
- keeping up to date with news and events (50.3%)
- watching videos, TV shows or movies (50.2%)
- finding new ideas or inspiration (44.8%)
- education and study-related purposes (38.1%)
- gaming (28.9%)
In addition, messaging apps (94.5%) and social networks (94.1%) continue to be the most visited categories. Games and entertainment remain relatively equal in terms of traffic – 32.3% and 32.6% respectively.
User preferences for video content
For 92% of users, the type of video content they consume doesn’t matter. However, many users can be categorized. For instance, 48.9% prefer music videos, 25.6% choose educational content, and 23.1% watch gaming videos.
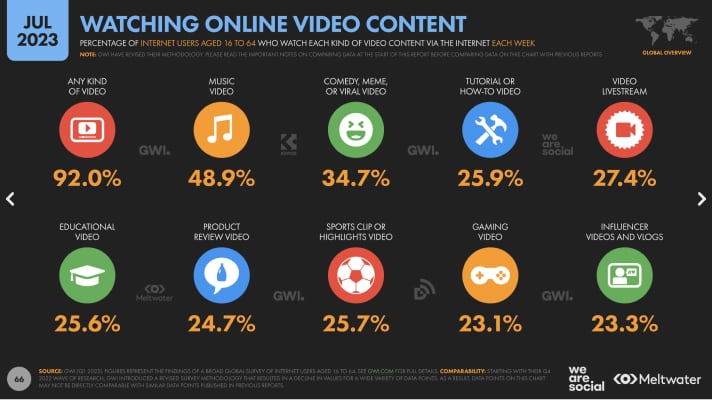
This information can be particularly valuable for advertisers. If you know what kind of content users prefer, you can intelligently choose promotion categories and allocate advertising budgets.
On the BYYD platform, we help brands place various types of content, including videos. Check out the latest video cases at this link.
Mobile gaming trends and top gaming devices in 2023
Of course, 80% of users worldwide don’t specifically favor a particular gaming device. However, a significant portion of users (65.6%) prefer playing mobile games on their smartphones.
Next on the list of gaming devices from the Digital 2023 July Global Statshot Report are desktops at 34.5%, gaming consoles at 23.2%, and tablets at 14.3%.
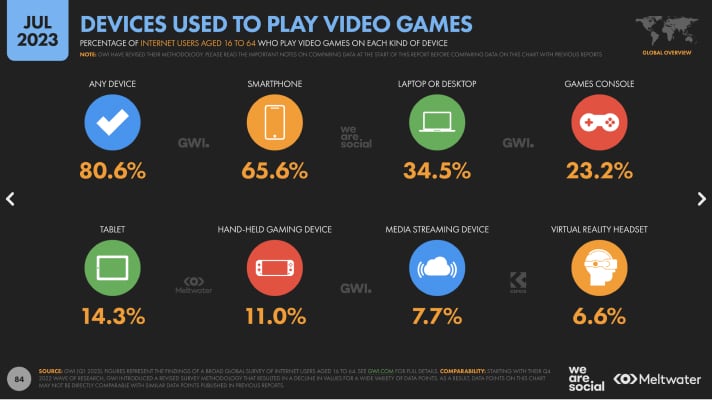
It is obvious that users prefer smartphones for a reason. They are convenient to use at any time of the day, at any place, without being tied to a location.
If you’re interested in launching a mobile campaign, feel free to contact us at hello@byyd.me
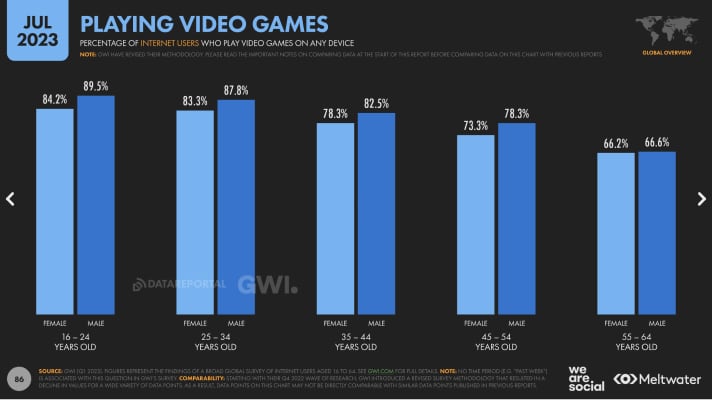
In addition, let’s look at one mobile gaming trend: the popularity of video games is particularly high among the male audience. However, the difference with the female segment is not so significant.
Thus, in the 25-34 age group, 83.3% of women and 87.8% of men play video games.
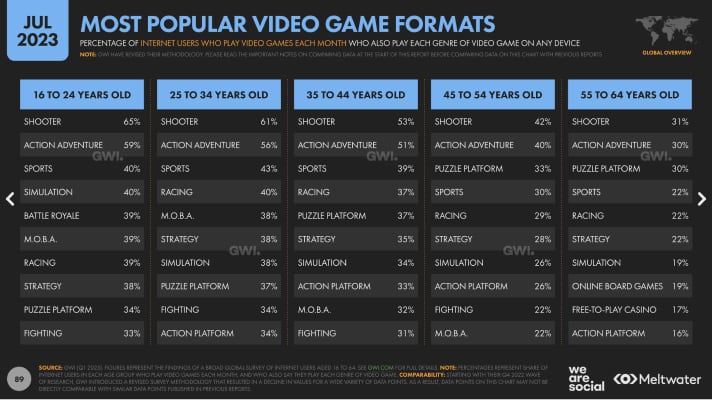
Most popular video game formats
The Digital 2023 July Global Statshot Report presented popular gaming formats categorized by age segments.
Each audience has its own preferences, but two formats are popular universally: shooter games and action-adventure games. Users also enjoy puzzles, racing games, and strategy games.
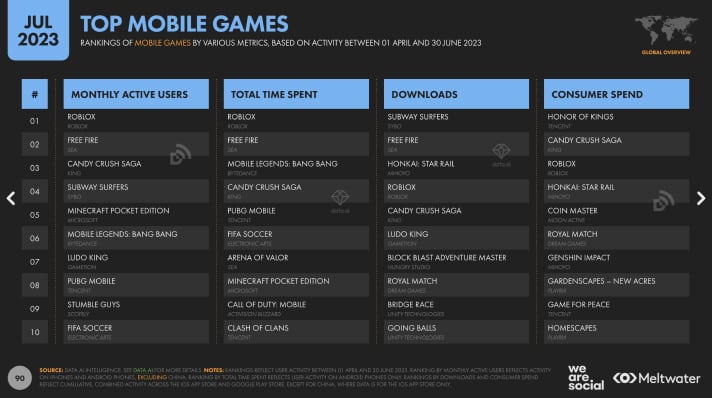
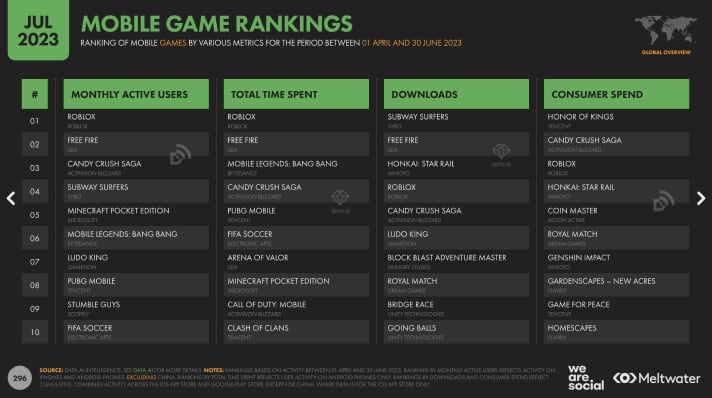
At the time the Data Reportal study was released, the following game apps had the highest number of downloads:
- Subway Surfers
- Free Fire
- Honkai: Star Rail
- Roblox
- Candy Crush Saga
- Ludo king
- Block blast adventure master
- Royal Match
Operating systems, mobile market, and popular gaming apps
As indicated by We Are Social and Meltwater data, the share of mobile traffic from devices with the Android OS stands at 70.79%. Meanwhile, the share of devices with the Apple OS amounts to 28.44%.
Regarding the mobile app market, positive trends are observable. For instance, the number of downloaded applications from April 1st to June 30th, 2023, is 38.6 billion. This figure effectively reflects a growth in downloads by 4.1%.
Moreover, according to the Digital 2023 July Global Statshot Report, users collectively spent 33.8 billion dollars on in-app purchases over three months, with an annual consumer spending growth rate of 6.1% (+1.9 billion dollars).
During these same three months, users spent the most time in the following apps:
- Roblox
- Free Fire
- Mobile Legends: Bang Bang
- Candy Crush Saga
- PUBG Mobile
- FIFA Soccer
- Arena of Valor
- Minecraft Pocket Edition
- Call of Duty: Mobile
- Clash of Clans
As you can see, mobile games are promising platforms with a large audience. Therefore, advertising in them is a great way to make yourself known and attract the target audience.
For this purpose, the programmatic platform BYYD is an excellent fit. We assist in buying advertising mobile traffic on smartphones and tablets within mobile applications and mobile games worldwide.
If you’re ready to start a branding campaign, feel free to contact us!
Was it useful? Then share it with your friends and colleagues!
For consultations and cooperation – contact through the form on the site.