Mobile games ranking and other insights from the Digital 2023 October Global Statshot Report
Here are the latest insights from the Digital 2023 October Global Statshot Report.
This time, platforms such as DataReportal, Meltwater, and We Are Social have placed special emphasis on topics related to personal data privacy, representation of nationalities in advertising, and the potential of artificial intelligence.
Below, you will find rankings of mobile games as of the end of 2023, a review of the digital market, and current data on mobile traffic.
Here is the summary from the Digital 2023 October Global Statshot Report:
- According to the latest data from the United Nations, as of October 2023, there are 8.06 billion people living on the planet. The world’s population has increased by 72 million people over the course of this year.
- As per information from GSMA Intelligence, in 2023, the usage of mobile phones increased by 2.7%, and the number of internet users rose by 3.7%.
- In October of the current year, the count of internet users reached 5.30 billion people, representing 65.7% of the world’s total population.
- Analysis conducted by Kepios indicates a rise in the number of active users on social media networks, reaching 4.95 billion people. This accounts for 61.4% of the global population.
The time spent by users on the Internet has increased again
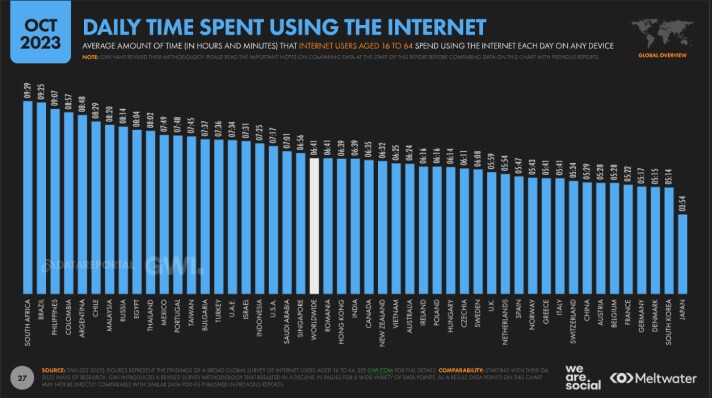
After a decrease in internet usage at the beginning of 2023, a slight increase has been observed. According to the latest data from GWI, over the past 12 months, the average Internet user has increased their daily online activity by 4 minutes.
Now, the average time spent online worldwide stands at 6 hours and 41 minutes. In USA, this figure is notably higher at 7 hours and 17 minutes.
Not only has the time spent on the internet increased, but also the number of smartphone owners. For instance, the share of owners of any mobile devices stands at 97.6%, while desktop ownership is at 58.6%.
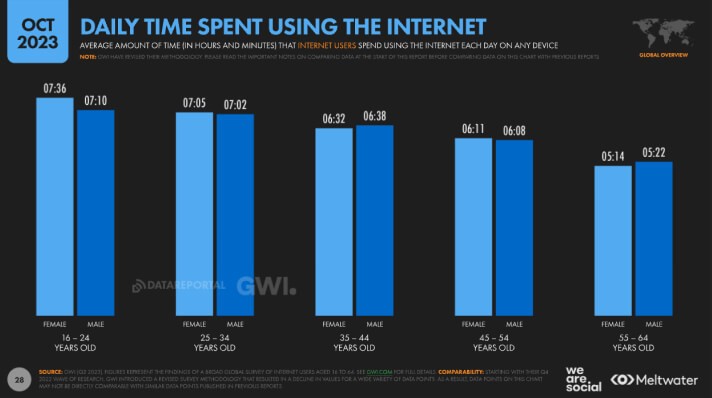
Regarding socio-demographic characteristics, there are no significant differences, except for distinctive characteristics among different age groups. For example, individuals aged 16 to 24 spend 2 hours more on the internet compared to users aged 55 to 64.
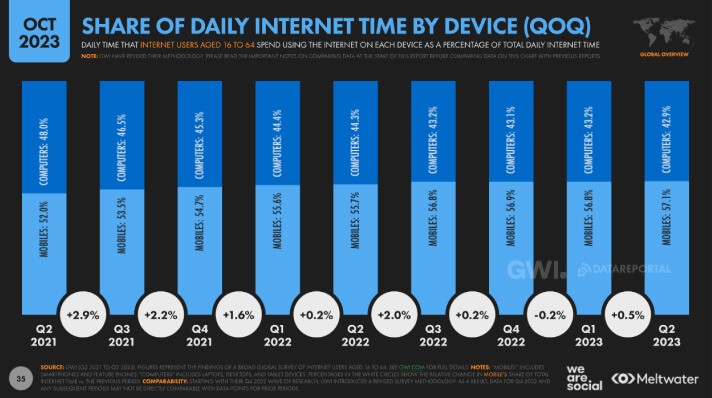
Users prefer browsing the Internet through smartphones
Indeed, users tend to favor using the internet through mobile devices. Currently, 57.1% prefer mobile devices, whereas 42.9% opt for desktop usage.
As observed in the July survey, the primary motivation for being online remains information search (60.1%).
However, there have been subsequent changes in the list:
- Watching videos, TV shows, or movies (51.8%)
- Product and brand searches (43.6%)
- Educational purposes (39.0%)
- Gaming (28.8%)
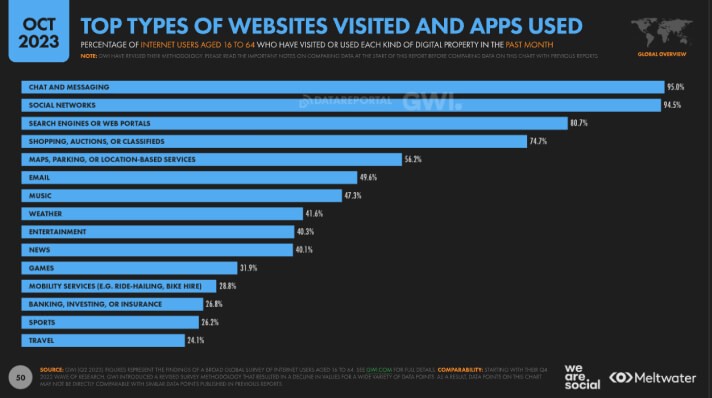
Websites and applications have their own statistics explaining the reasons for their visits. Chat and messenger applications remain the leading category (95.0%). Following in the list are:
- Music (47.3%)
- Weather (41.6%)
- Entertainment (40.3%)
- Games (31.9%)
- Sports (26.2%)
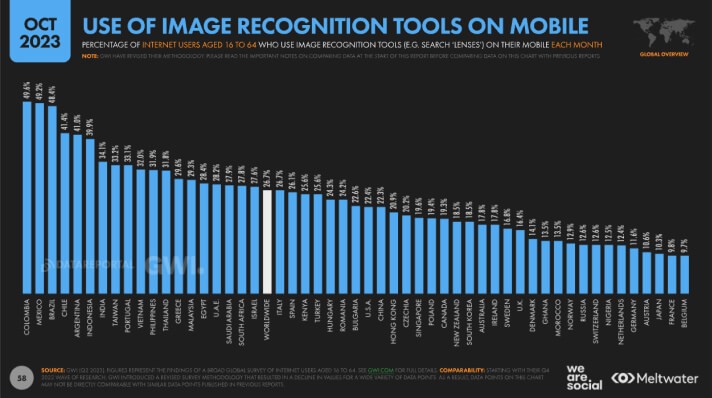
How artificial intelligence assists mobile users
The improvement in AI over the past year has increased its utilization among users. This prompted DataReportal, Meltwater, and We Are Social to focus on the significance of voice assistants, image recognition, and text translation in the context of AI development in their recent study.
On average, 20.0% of users employ a voice assistant for information retrieval, 26.7% utilize image recognition on their phones, and 28.5% make use of online translation tools.
We delved into the theme of artificial intelligence and its impact on marketing professionals’ work in this article.
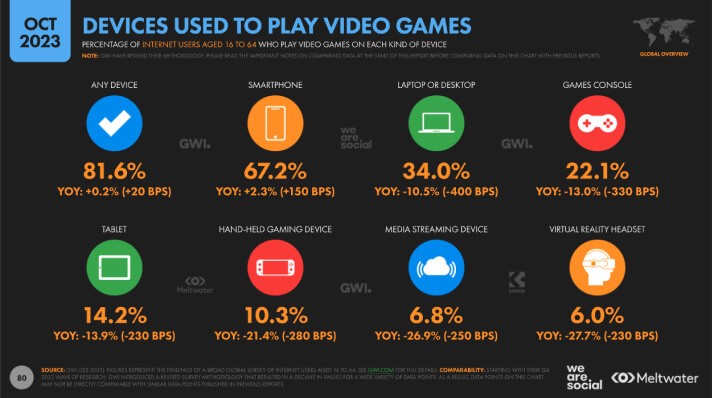
How many users play video games
Currently, 81.6% of users worldwide play video games. As expected, they prefer using mobile devices (67.2%) for this purpose.
As for other devices, the situation is as follows:
- Desktop (34.0%)
- Gaming console (22.1%)
- Tablet (14.2%)
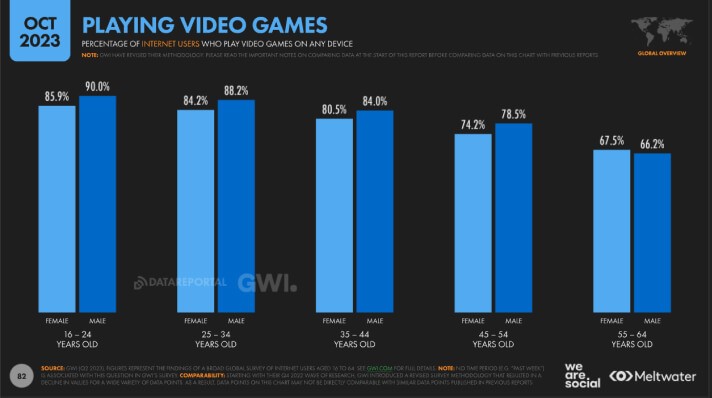
Men spend more time playing games compared to women. However, the difference is not significant, approximately around 3%.
Nevertheless, there is a clear correlation between age and time spent on video games. The audience aged 16-24 devotes nearly 90% of their leisure time to gaming, while individuals aged 55-64 spend approximately 65%.
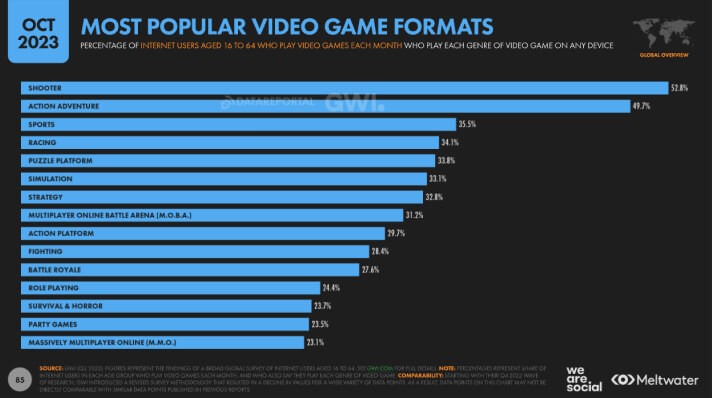
Video Games: popular formats and applications
The Digital 2023 October Global Statshot Report presented a list of popular formats overall and segmented them by age categories.
The most popular formats among the audience aged 16-64 years old are shooters (52.8%) and action-adventure games (49.7%). Users also enjoy racing games (34.1%), puzzle platforms (33.8%), and strategy games (32.8%).
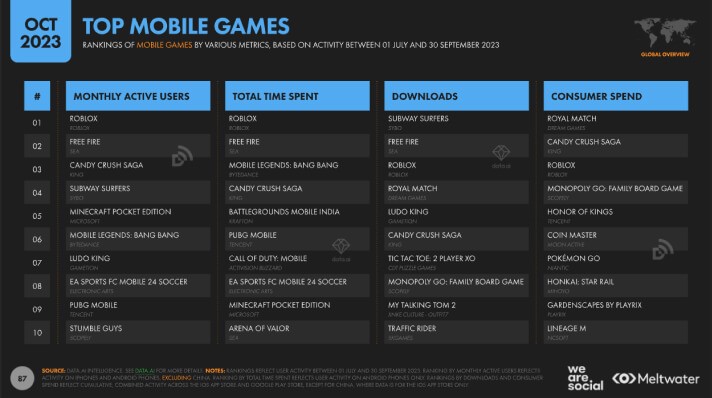
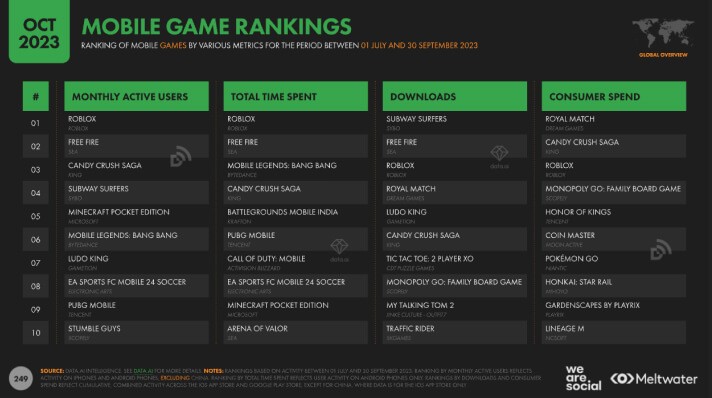
When it comes to popular mobile video games, at the time of the research release, users were more active in the following apps:
- Roblox
- Free Fire
- Candy Crush Saga
- Subway Surfers
It is interesting to note that certain sets of apps in different variations have remained popular for a long time. However, new games, such as Honkai Star Rail, appear regularly.
Information about the autumn gaming novelties on Apple Arcade was covered here.
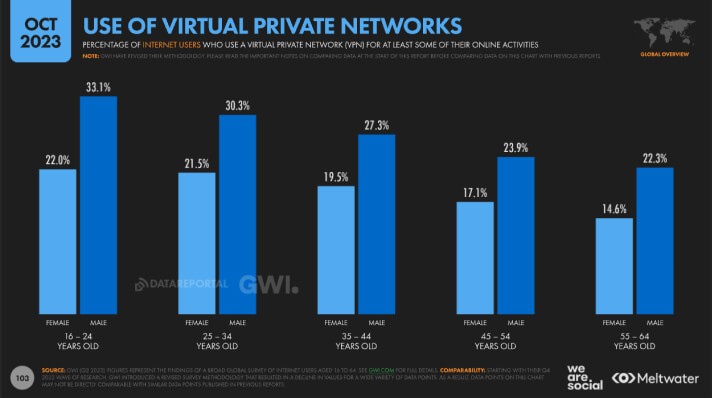
Why users use VPNs
In their research, experts from DataReportal, Meltwater, and We Are Social addressed the topic of Virtual Private Network usage.
Consequently, the average global usage percentage of VPNs stands at 24.3%. In several countries, the situation appears as follows: Bulgaria (16.3%), Saudi Arabia (30.6%), Turkey (31.4%). The country with the highest VPN usage percentage is the UAE, where this figure reaches 38.6%.
Check out this material on the topic and contact us at hello@byyd.me to initiate a mobile campaign.
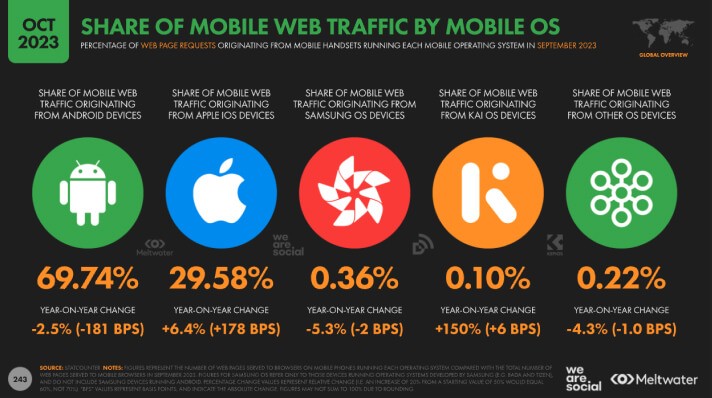
The volume of mobile traffic has increased
According to the Digital 2023 October Global Statshot Report, over the last 6 years, the volume of mobile traffic has significantly surged. On average, the monthly data consumption on smartphones amounts to 20.4GB.
Regarding operating systems, Android continues to dominate among them, comprising 69.74%. Following are devices with iOS (29.58%), Samsung (0.36%), and KAI (0.10%).
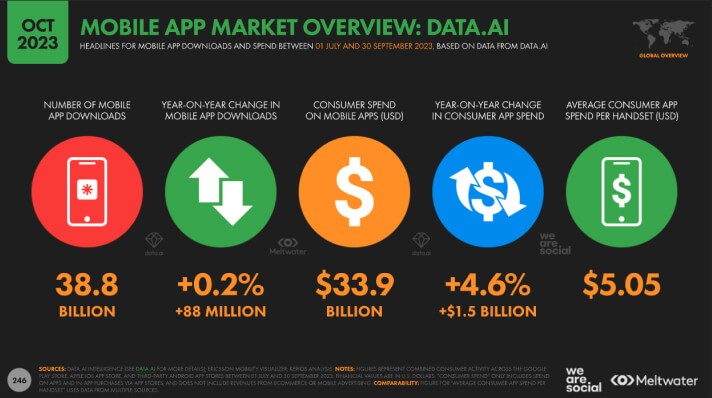
Review of the mobile app market
The mobile applications market continues to expand. The total number of downloads has reached 38 billion, reflecting an annual growth rate of 0.2%.
User spending within applications has also increased. On average, users invested approximately $33.9 billion across platforms. This demonstrates a healthy growth rate of 4.6%.
Experts from DataReportal have also highlighted a list of apps that showed increased popularity during the period from July to October 2023. Users were most active on platforms such as:
- Pokemon Sleep
- Battle round mobile India
- Monopoly go family board game
- Avatar word games for kids
Regarding downloads, the following applications garnered the most:
- Tic Tac Toe 2 Player XO
- My Perfect Hotel
- Real Car Driving: Race City 3D
- Dancing Cats
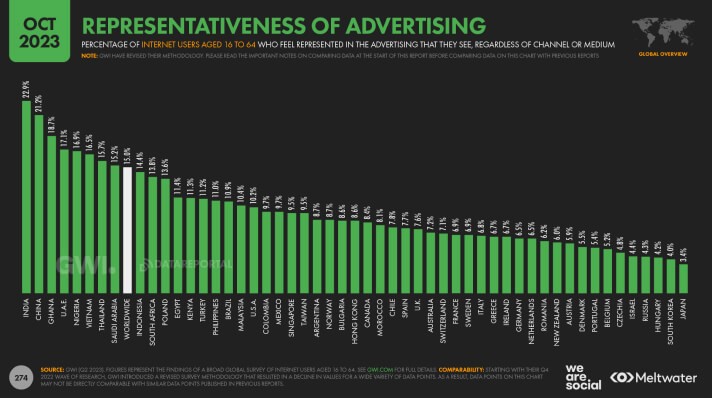
Representation of nationalities in advertising
Diverse representation matters in today’s marketing. Showing a variety of people helps connect with a broader audience and reflects our diverse world.
Recent data reveals that, on average, 15% of the global audience aged 16 to 64 see themselves in advertising materials. The lowest percentage comes from Japan (3.4%), while the highest is in India (22.9%).
For comparison, in other countries, the data is as follows:
- China (21.2%)
- UAE (17.1%)
- USA (10.2%)
- Australia (7.2%)
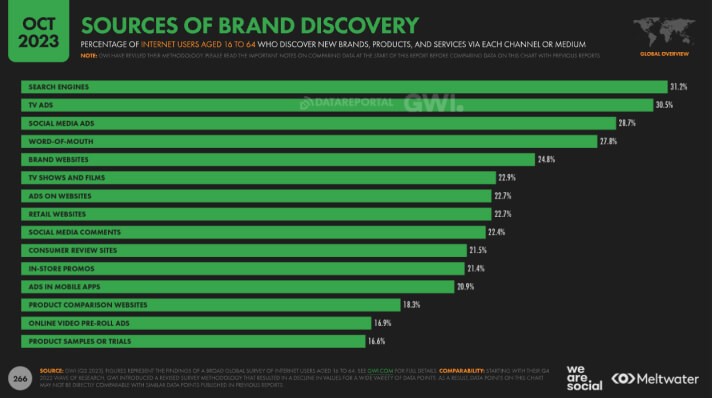
How users discover brands online
Understanding where clients come from is a critical question for many companies. Data from the Digital 2023 October Global Statshot Report provides essential insights.
For the digital audience aged 16 to 64, they become aware of new brands, products, and services through:
- Search engines (31.2%)
- Social media advertising (28.7%)
- Brand websites (24.8%)
- TV shows and movies (22.9%)
- Mobile app advertising (20.9%)
As we can see, mobile advertising remains a key method for discovering brands online. It not only informs users about promotions but also contributes to building audience loyalty and attracting users to brand platforms.
BYYD has been involved in mobile app advertising for over 8 years. Our professionalism is backed by thousands of campaigns.
Register and launch in-app advertising using one of the top platforms for mobile ad buying – BYYD’s programmatic platform.
Was it useful? Then share it with your friends and colleagues!